
ScaleAble software
Shopify profit analytics
built for scaling decisions.
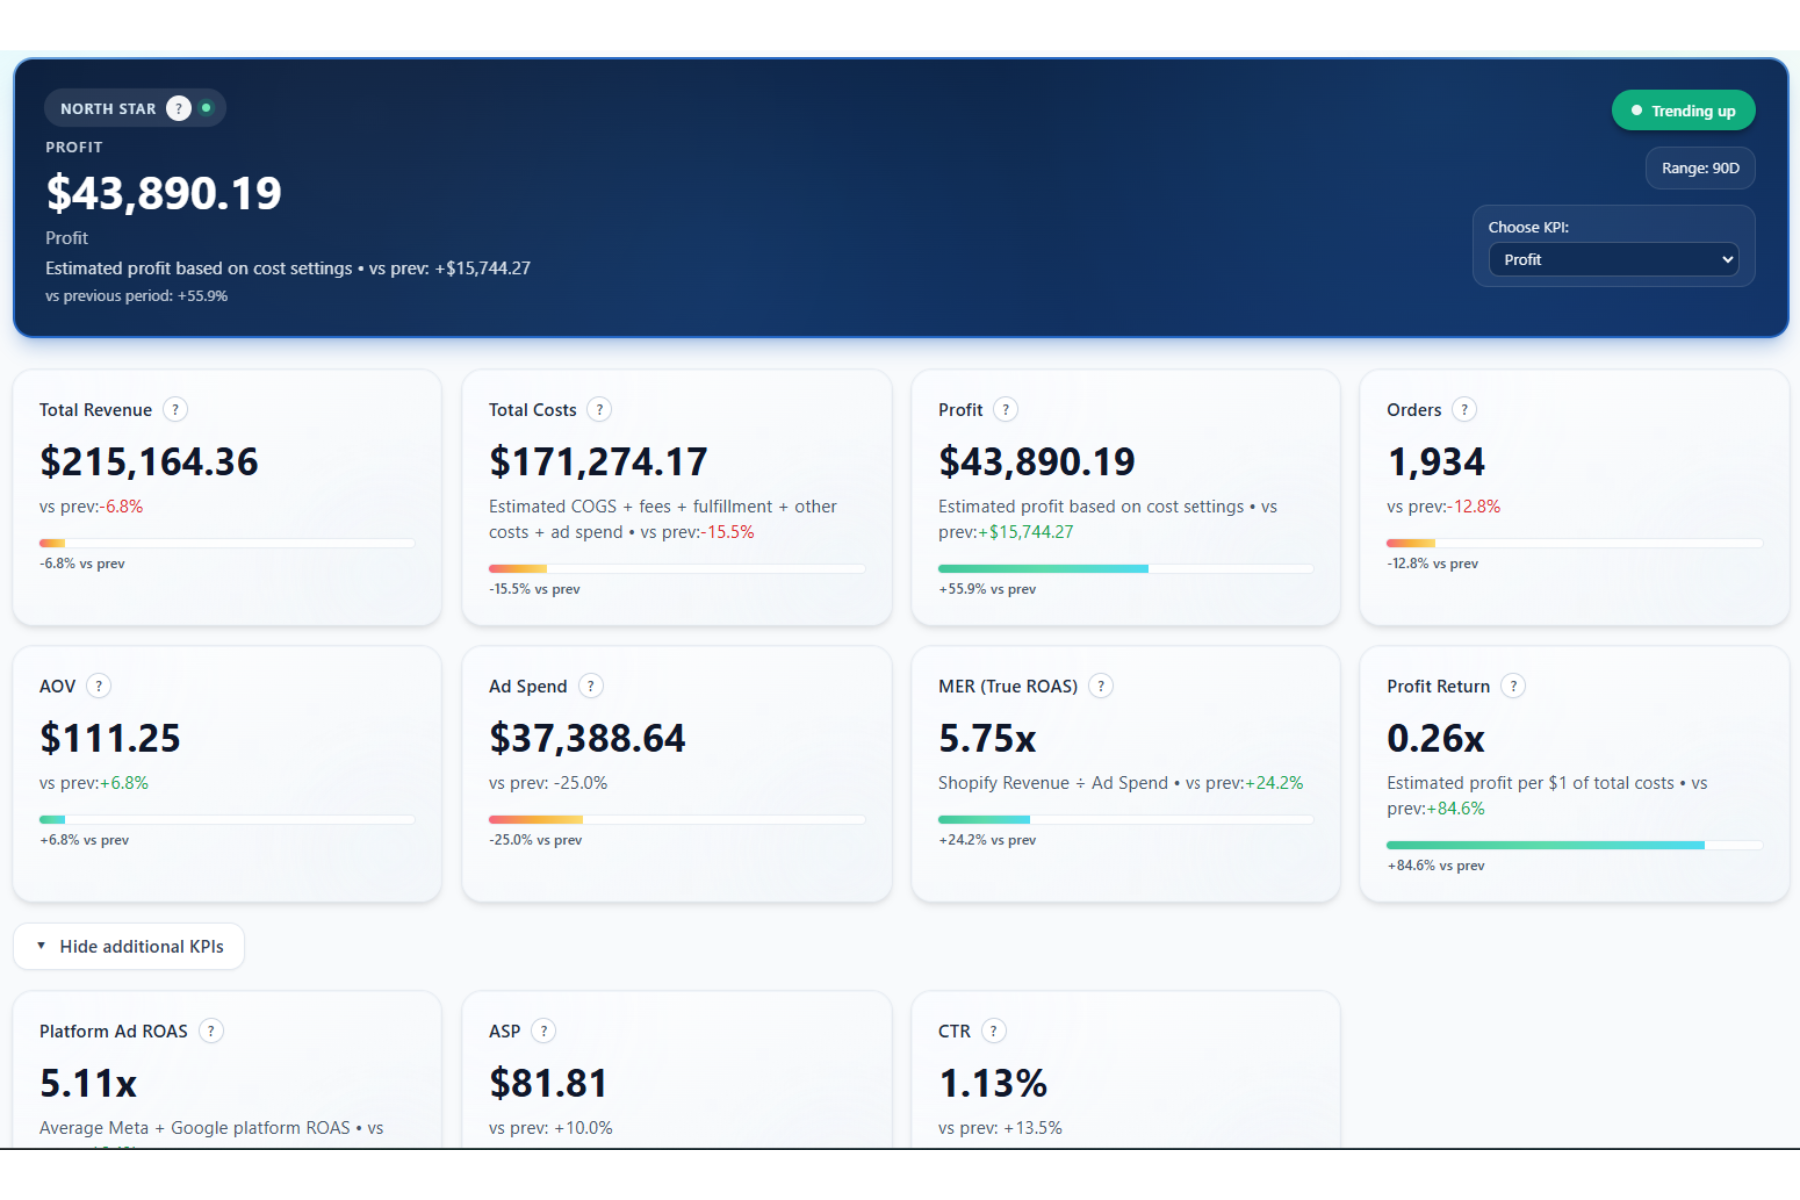
Shopify revenue, your real product costs and ad spend from Google and Meta in one model — so you can see profit, not just what the ad platforms report about themselves.
How it works
Four inputs. One honest number.
The model is not complicated. Getting brands to trust it is the hard part — which is why every cost is yours to define and every figure traces back to a real Shopify order.
Shopify
Orders, revenue, products, refunds and channel attribution.
Google Ads
Spend, conversions and campaign-level performance.
Meta Ads
Spend, results and attributed revenue.
Your costs
COGS, shipping, fulfilment, fees, packaging, custom expenses.
Profit
Revenue after product and variable costs — the number worth scaling.
Contribution margin
Where margin sits today and how it moves as spend changes.
MER / True ROAS
Total revenue over total spend, independent of platform attribution.
Product profitability
Profit, margin and profit per unit for every SKU.
Channel mix
Paid, organic, direct and unknown revenue against spend.
Event impact
Measured before/after effect of every change you make.
Watch what happens to profit as spend goes up
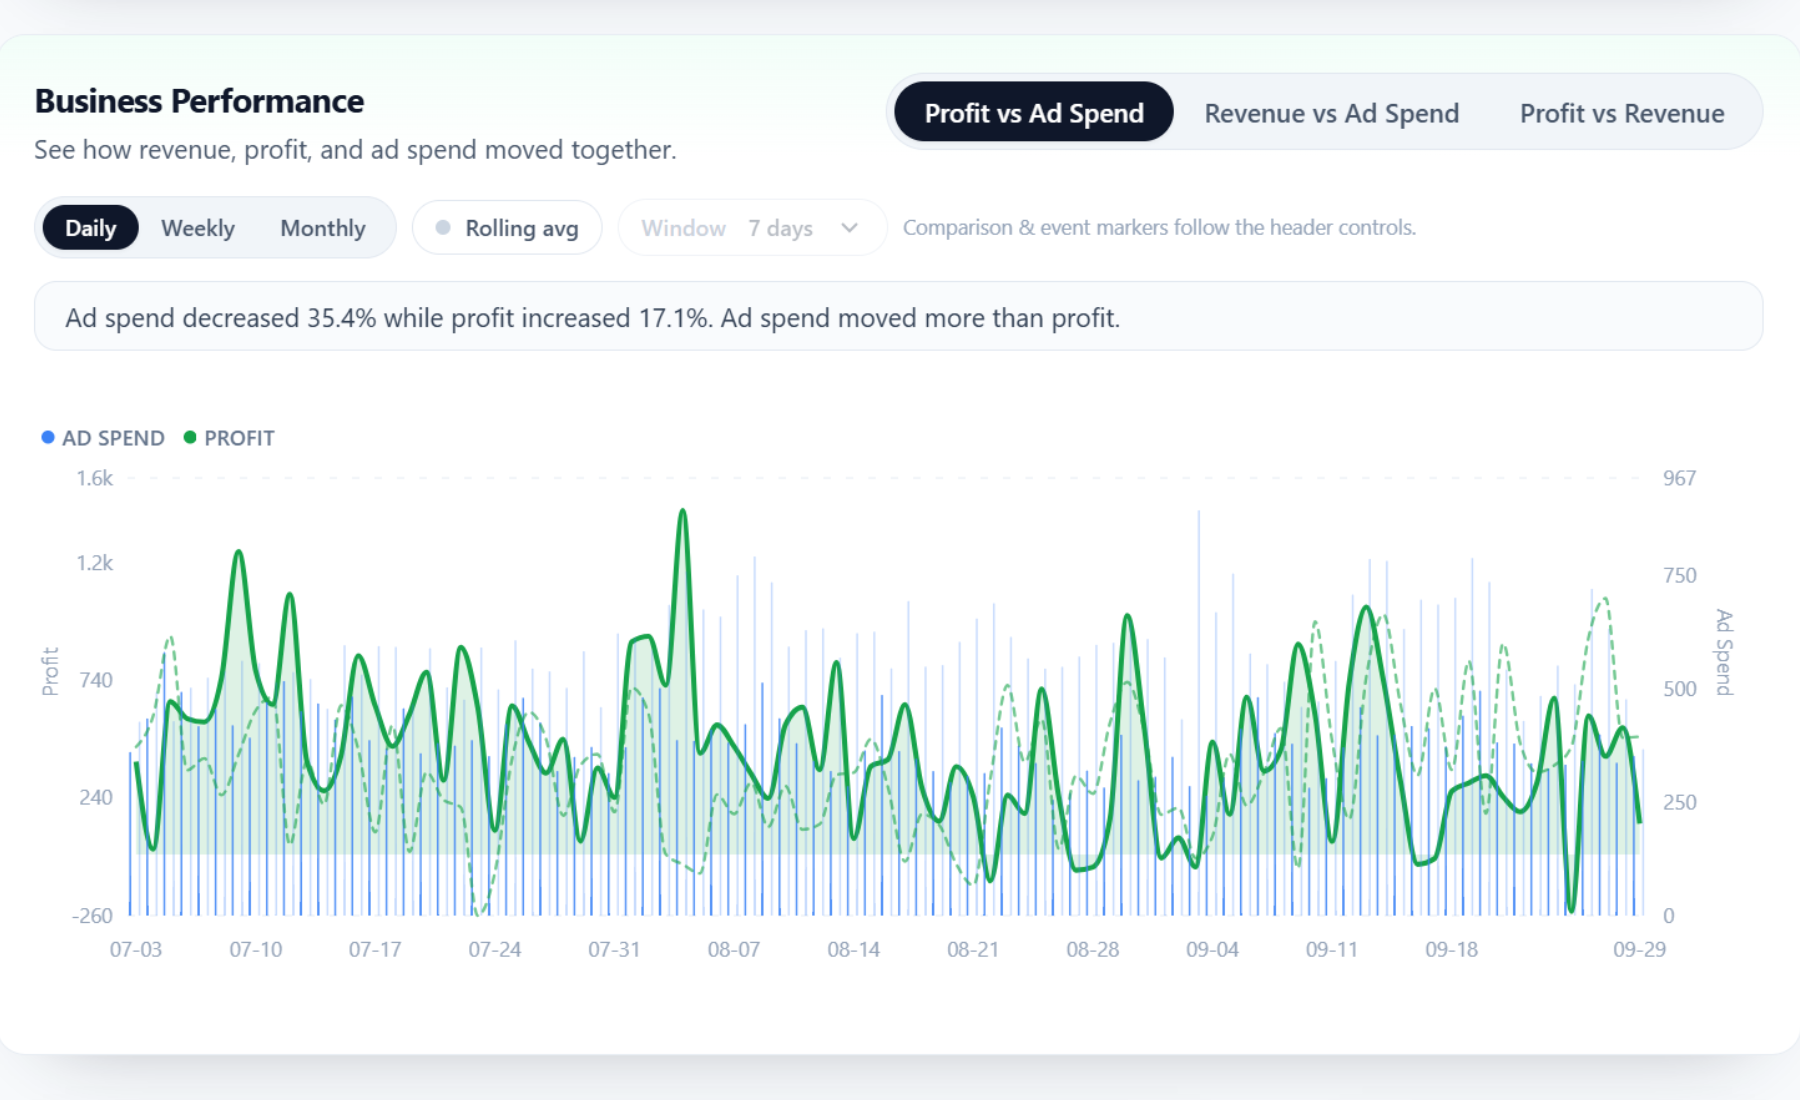
The single view that changes how brands scale. Ad spend and profit plotted together, so the point where additional spend stops producing additional profit is visible instead of theoretical.
- Profit charted against daily and monthly ad spend
- Spot the spend level where margin starts to compress
- Compare periods before and after a budget change
- See profit per additional dollar of spend, not just ROAS
Platform ROAS on one line. Business truth on the other.
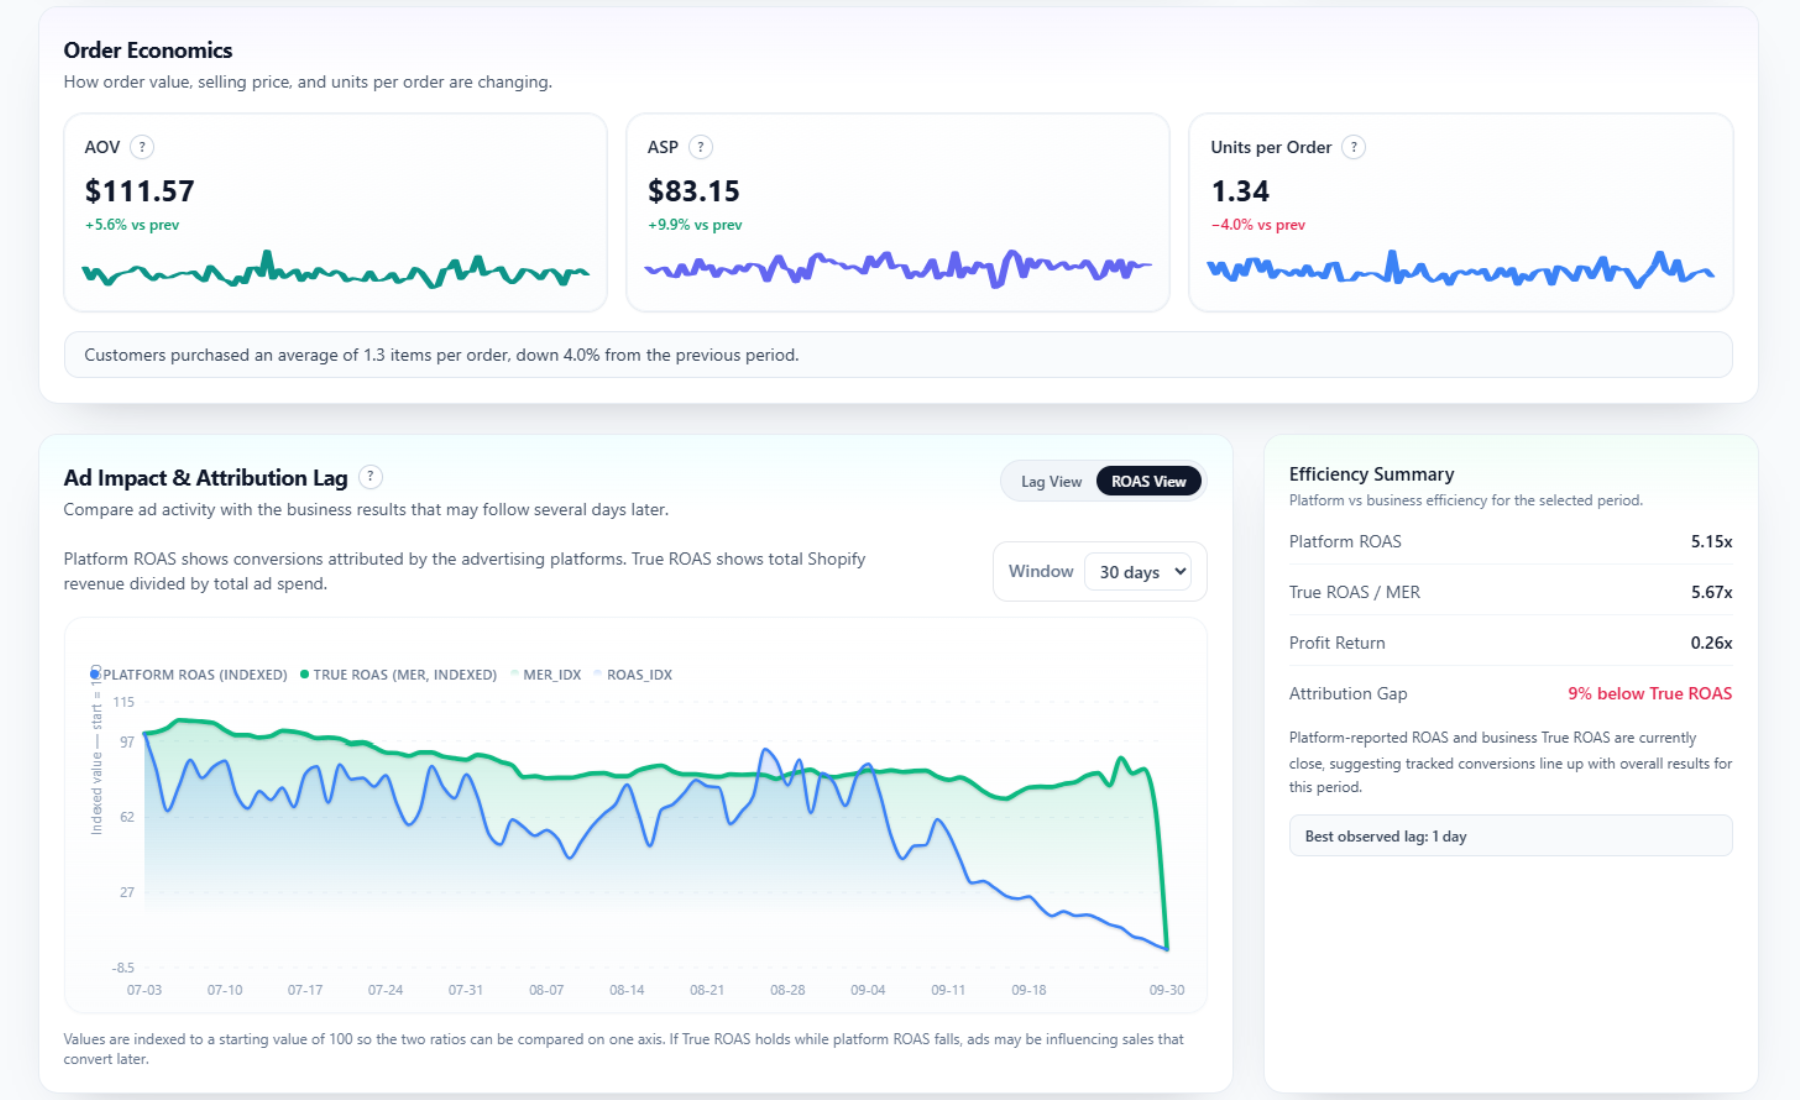
Google and Meta each report the conversions they believe they caused. ScaleAble puts blended MER — total Shopify revenue over total ad spend — alongside platform-reported ROAS so the gap is measurable.
- Blended MER / True ROAS trended over time
- Forward-window attribution to see delayed revenue impact
- Identify when platform ROAS looks healthy but blended performance is falling
- A shared number that ends the attribution argument
Which products are actually worth scaling
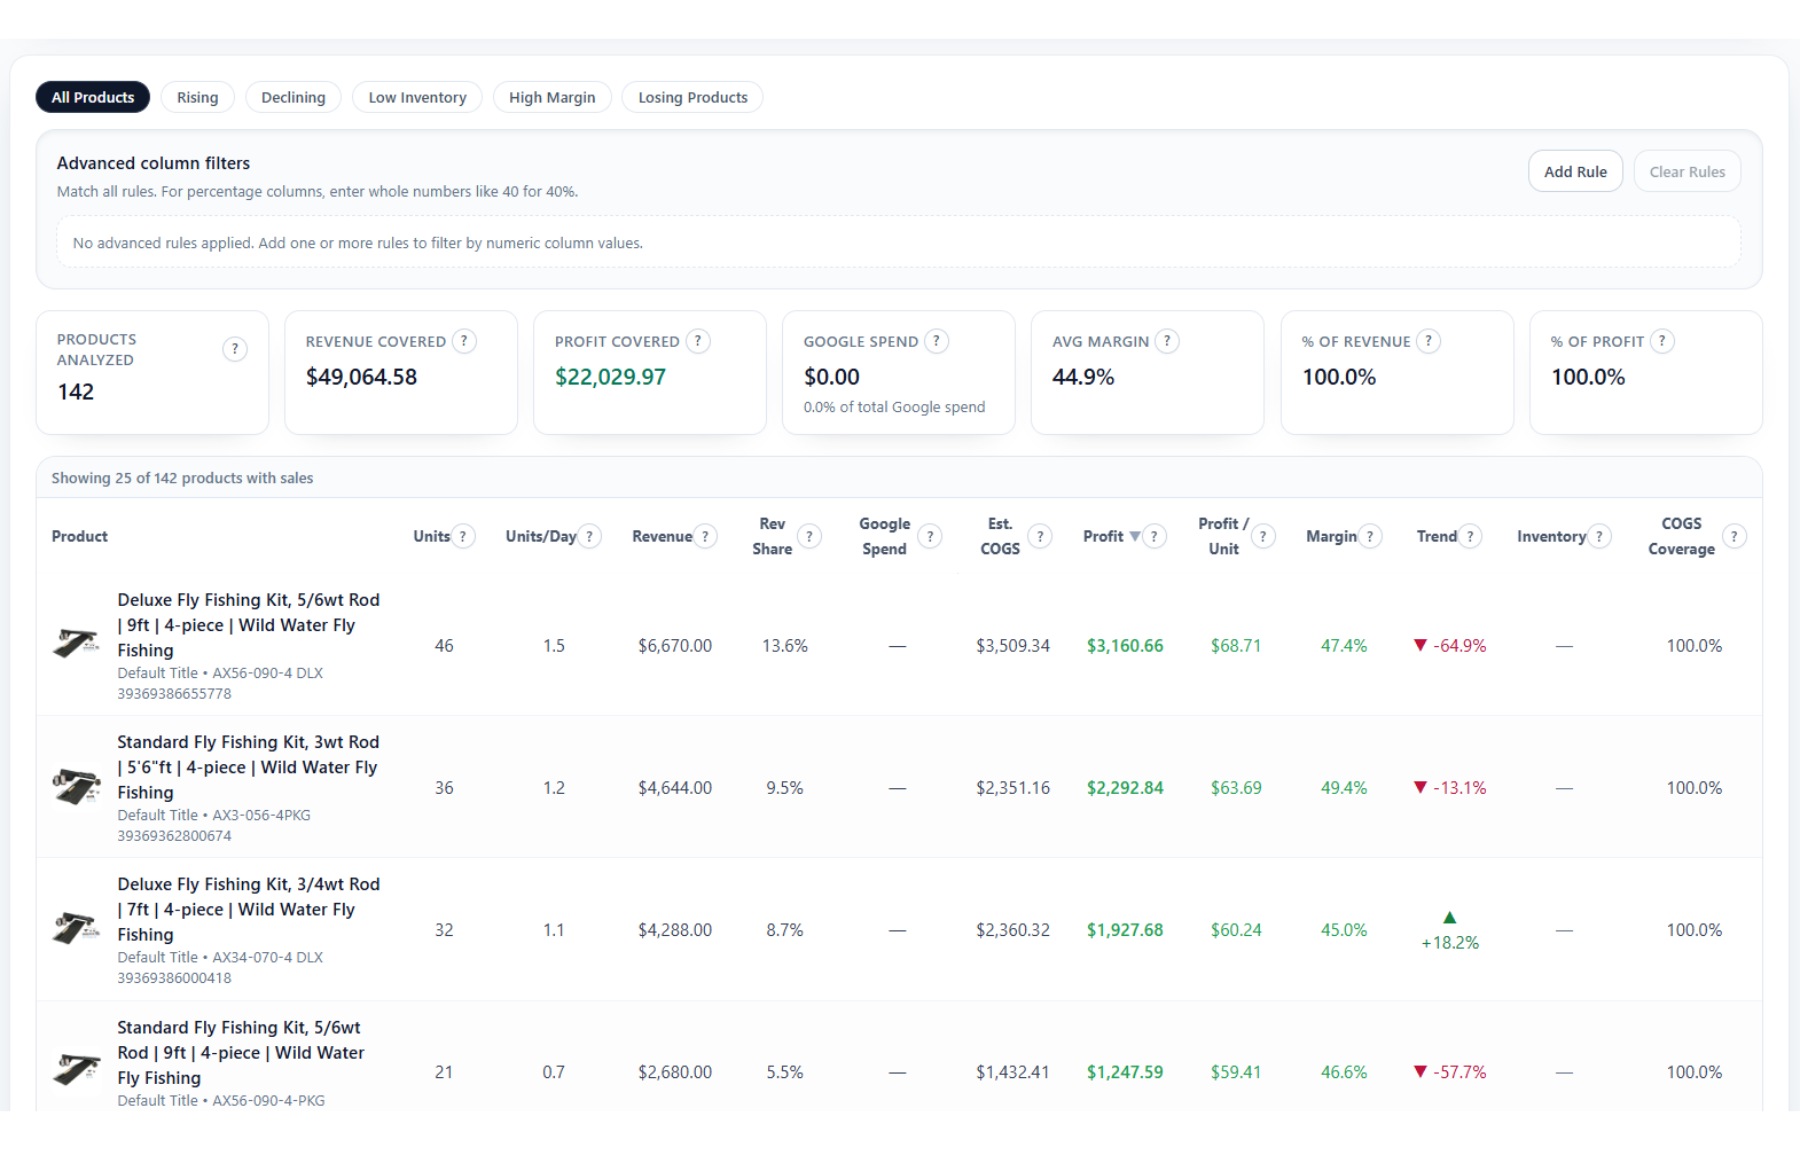
Store-level reporting hides the problem. ScaleAble applies real per-product costs so you can see revenue, profit, margin and profit per unit at the SKU level — the list that decides where budget goes.
- Revenue, profit, margin and profit per unit by product
- True cost per product after COGS, shipping, fulfilment and fees
- Rising products, declining products and low-inventory risk
- The shortlist we build Shopping and catalog campaigns around
Paid spend moves organic and direct too
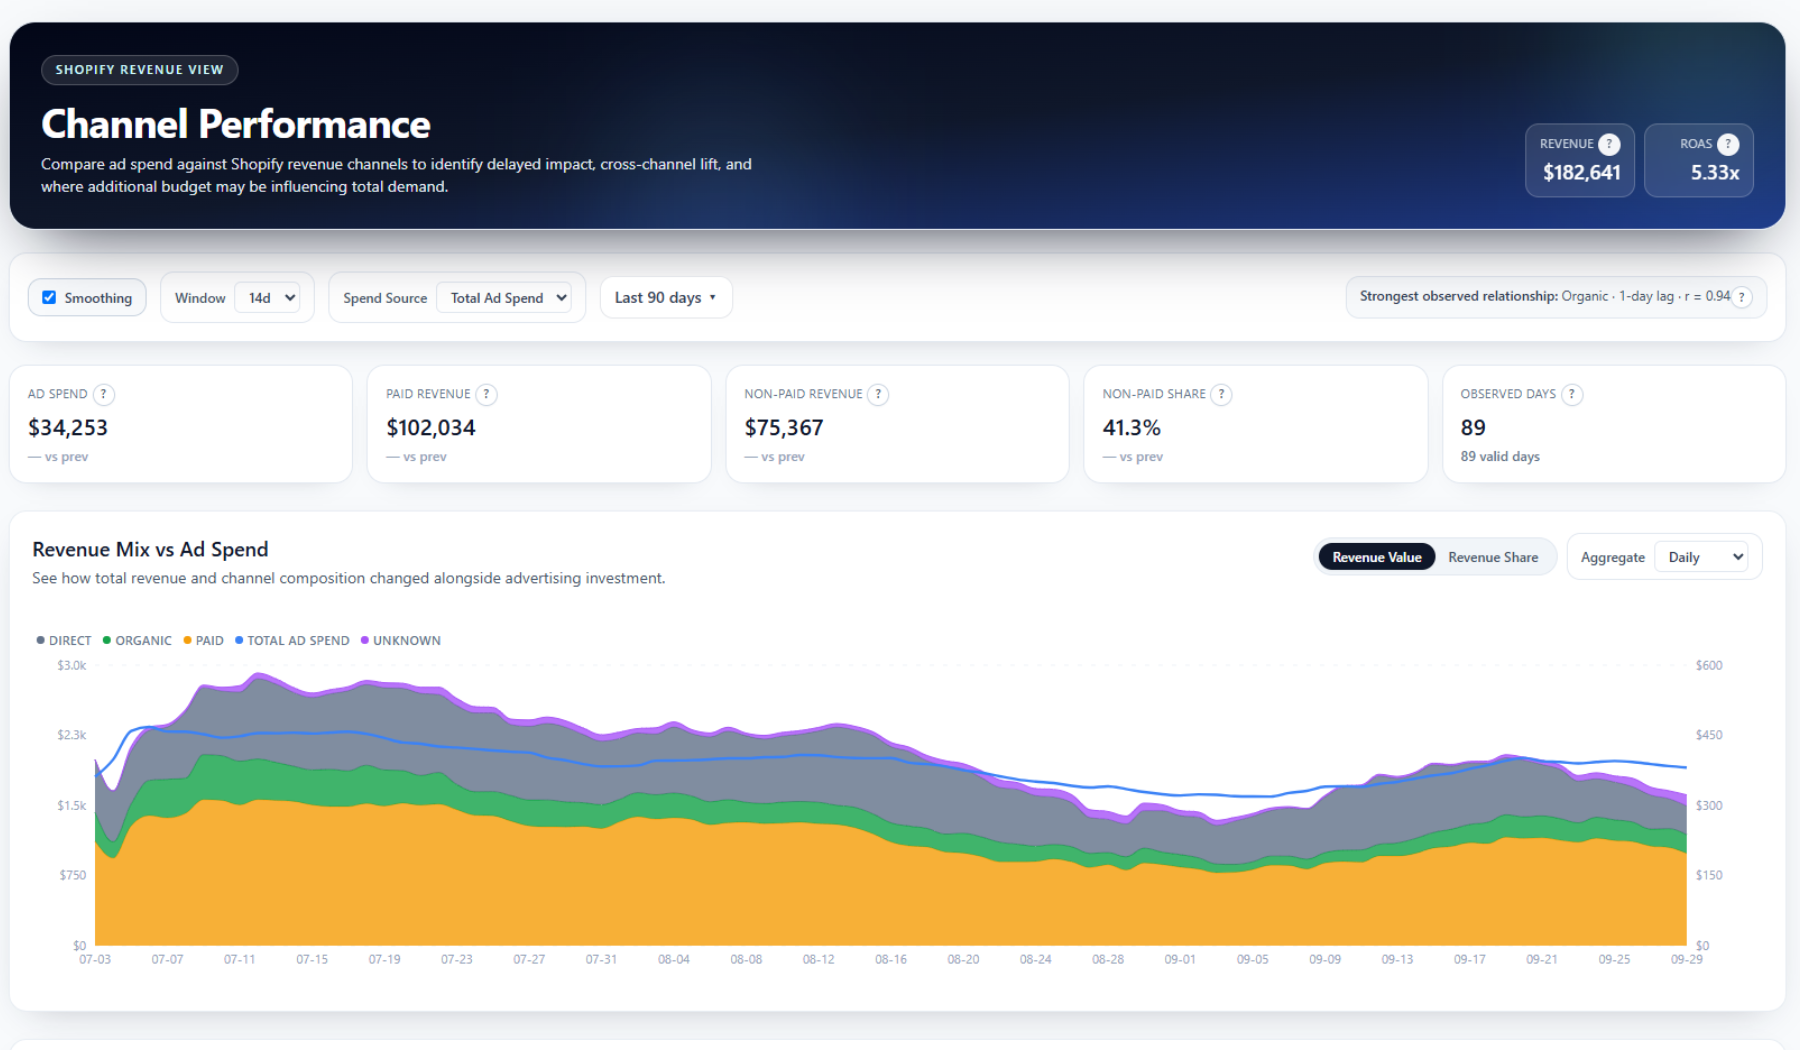
Advertising rarely stays in its own lane. ScaleAble charts ad spend against paid, organic, direct and unknown revenue so the halo effect — or the lack of one — is visible instead of assumed.
- Ad spend compared to organic, direct, paid and unknown revenue
- See whether scaling paid lifts or cannibalises other channels
- Quantify halo effects single-channel dashboards miss
- Better context for brand vs. non-brand budget decisions
Cause and effect, recorded as it happens
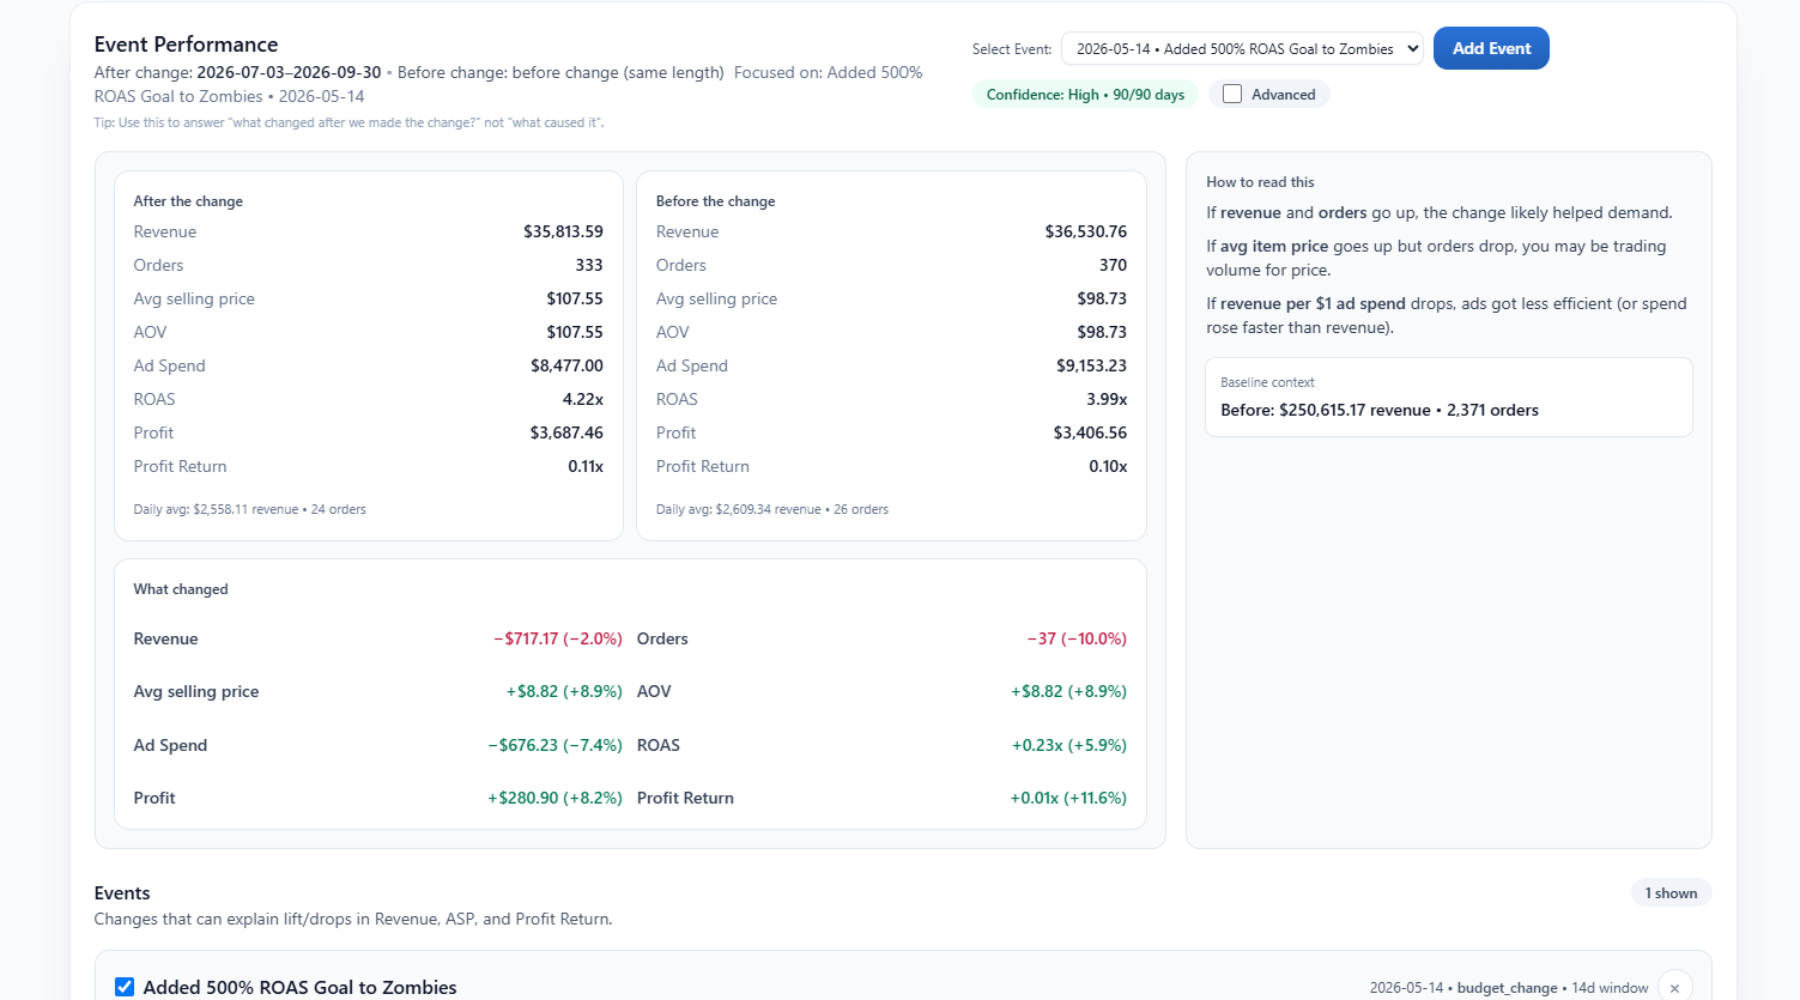
Price change, promotion, budget shift, new campaign, supplier change. Every material decision gets marked, then compared before and after — so performance conversations are about evidence rather than memory.
- Mark pricing, promotion, budget and launch events
- Before / after comparison on revenue, orders, profit and AOV
- Understand why profit moved, not just that it moved
- A clean audit trail of everything we changed
What you get to answer
Questions a normal ecommerce dashboard can't settle.
ScaleAble is not another reporting layer. It exists to end specific arguments about where budget should go.
- 01
Are we still profitable at this level of spend?
- 02
Which products are actually worth scaling?
- 03
Did profit move because of spend, price, promo or mix?
- 04
Is paid lifting organic and direct, or cannibalising them?
- 05
Where does margin start to break?
Good data still needs someone to act on it.
Plenty of brands install ScaleAble, see exactly where profit is leaking, and then run out of time to fix it. If you would rather have the campaign work, creative testing and conversion changes handled, that is our managed growth service.
We run the Google Ads and Meta Ads accounts
We build and test the creative
We recommend the onsite conversion changes
You keep the profit data either way
Software questions
Before you install.
What data does ScaleAble connect to?
Shopify for orders, revenue, products and channel data; Google Ads and Meta Ads for spend and performance; and the product and business costs you define — COGS, shipping, fulfilment, processing fees, packaging and custom expenses.
What is profit?
Revenue minus the variable costs of producing and delivering the order — product cost, shipping, fulfilment, payment processing and packaging — before fixed overhead. It is the number that tells you whether an additional order was actually worth having.
What is MER or True ROAS?
Total Shopify revenue divided by total advertising spend across all platforms. Unlike platform ROAS it does not depend on any ad network's attribution model, so it cannot double-count the same order twice.
How long does setup take?
Connecting Shopify and the ad platforms is quick. The work that matters is entering accurate costs — the output is only as good as the cost data behind it.
Get started
Install it on Shopify, or let us run the whole thing.
ScaleAble is on the Shopify App Store. If you want the media buying handled as well, book a call and we'll look at your accounts first.

$1,500 per month
Paid search, paid social, creative, CRO and profit analytics in one retainer.